
The market offers a wide range of spreadsheet applications, but MS Excel is considered the best and most widely used worldwide. Individuals, teams and entire organizations have been using MS Excel for three decades. Read our beginner's guide to Microsoft Excel to learn more about the program's features, including how to make a chart in Excel.
It is a spreadsheet that provides tools for operations with data and tables, performing calculations, data analysis (including statistical) and many other functions. Using advanced macros, more complex or automated computational tasks can be performed. Microsoft Excel is part of Microsoft 365, formerly known as Microsoft Office.
Tip: Don't have Excel on your computer yet? We've covered installing the program in more detail in our article Excel Basics: installation and basic setup.
Excel is thus a robust tool with countless functions and a large number of commands. It helps you sort and visualize data, which is great, and it can be used in a variety of industries. Below, we will list a few key things that can be implemented with a basic knowledge of Excel:
In the following text, we will focus on three key and basic elements of Excel that every beginner should know.
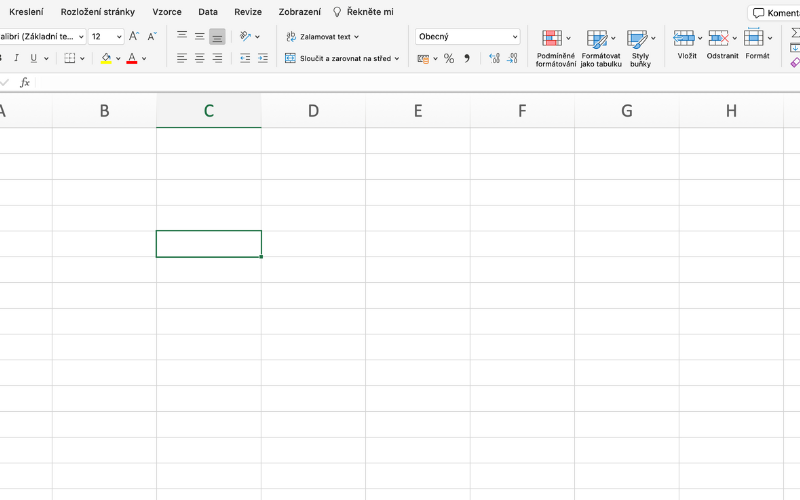
1) Cell: The cell is the smallest but at the same time very useful element of Excel. You can paste, copy and write your data into it. This applies to both written text and numbers. You can adjust the size of the cell freely, changing the background color, text, borders, etc. Each cell is uniquely identified by its address, which combines the column number and row number. In the picture you can see the cell on row 5 in column C. Its address is therefore C5.
2) Worksheet: The workbook contains a set of cells and also an invisible layer where graphs, images or diagrams can be placed. Other workbooks can be found and switched at the bottom of the window.

3) Workbook: a workbook is a separate MS Excel file that can contain one or more workbooks. You can add or remove workbooks, hide them without removing them from the workbook and rearrange them.
While a sheet is made up of a collection of cells and may contain charts or images, a workbook is a file that may contain one or more such sheets. Thus, a workbook is a file structure that allows the organization and management of multiple workbooks, whereas a sheet is a single page where the user can work with data. Sheets can be added, removed, or rearranged within a workbook, allowing flexible organization of data and information.
Opening a new workbook in MS Excel:
The basic Excel interface resembles an accounting ledger with columns marked with letters at the top and row numbers on the left. It resembles a calendar, with the names of the days of the week at the top and the corresponding days of the month in the rows below them. Each column is unique and cannot be repeated, just like the days of the week on a calendar. Columns contain cells, and in more complex reports, Excel can include tables with large numbers of columns and rows.
In the world of Excel, we often come across two terms that are used in calculations: excel formulas and functions. Although these terms are often confused and many think they are identical, there are differences between them. So let's take a look at the differences between a function and a formula in Excel, as well as their specific uses.
In Excel, a formula is a way to perform calculations with values stored in cells. Each formula begins with an equals sign (=), followed by a mathematical or logical expression. A formula can work with a single cell value, but it can also combine values from multiple cells to calculate a new value.
Example: to add the values in four cells (D3, D4, D5 and D6), do the following:
Select the cell in which you want to display the result of the sum (for example, cell D7).
Click in the form row at the top of the screen (or simply start typing in the selected cell), and enter the equation (=).
Now enter the formula for the sum: D3+D4+D5+D6 and press Enter.
Excel will now add the values from those cells and display the result in cell D7.
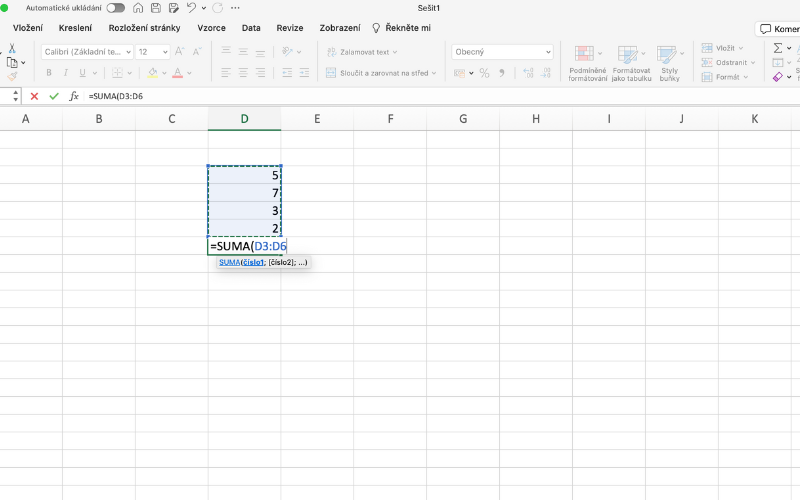
Functions in Excel are predefined formulas that make it easy to perform common calculations. This way, you don't have to enter each formula manually. Functions have names derived from the mathematical operations they perform.
Example: Using the =SUM(D3:D6) function, you can easily add all the values from D3 to D6 without having to enter the entire formula manually.
If you're a beginner and need to get familiar with what features exist in Excel, we recommend you contact Microsoft's official online support or use the online tutorials.
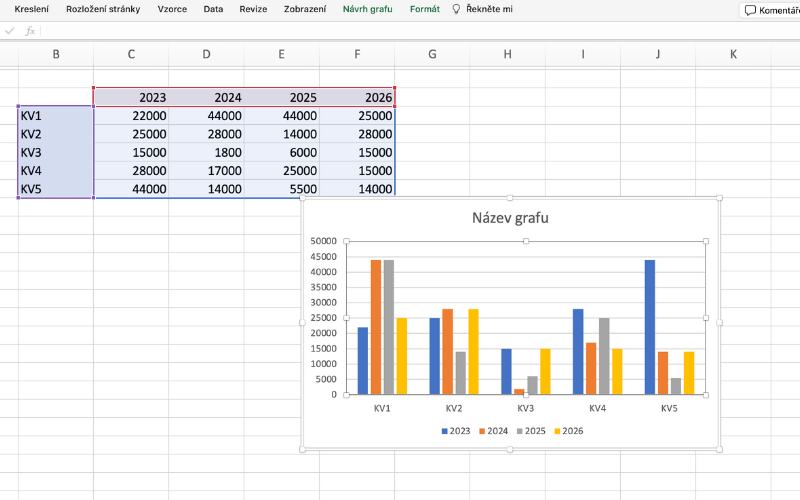
Creating a chart in Excel can be an easy task if you know how to do it. Charts are used to visualize data and track trends. Now we will look at how to create a simple bar chart in Microsoft Excel.
Procedure:
Encrypting an Excel document is important for several reasons. First of all, it helps to protect sensitive or important information from unauthorized access or modification. The password ensures that only people who know the password can open or edit the document, which is especially important in a corporate environment.
The passwording process is similar to Microsoft Word, making it easy for users to learn how to password their documents in multiple Microsoft Office programs. Specifically:
Once these steps are complete, your Excel document will be encrypted and a password will be required the next time you open it. If you need more information on how to password protect excel, read the detailed instructions directly from Microsoft.
Interested in more how-to articles? Visit our blog pages to learn more about other programs such as MS Word, Outlook, Power Point and Teams.

Copyright © 2026 - Algotech a.s., all rights reserved
| Personal data processing |
Terms and conditions