Ansoff matrix - although it might seem so at first glance, fortunately this is not a Russian sequel to the famous sci-fi tetralogy by the Wachowski siblings. In the following lines, we will discuss the issue of market share, and in particular the so-called Ansoff matrix, one of the tools of strategic management of a company. Learn how the Ansoff Matrix helps you identify opportunities for market share growth and offers four possible growth strategies.
What is the most important thing in your company? Is it people, technology or company processes? Or is it your unique know-how? From a purely business perspective, the most important thing is to generate profit. From this, other goals and milestones should be derived and achieved - ideally through some kind of predefined plan.
What should such a plan look like? Ideally, it should set out long-term activities and directly include a process for how we will achieve the specific goal set out. If we have such a plan, we are already talking directly about strategy; if it supports the development of the business in terms of further expansion, it is directly a growth strategy.
→ Tip: You might be interested in how you can effectively use SWOT analysis to achieve your business goals.
The basic principles of strategic management are based on building a strong and valuable market position. These basic principles also imply the creation of appropriate corporate processes that should subsequently coordinate corporate activities. In all cases, these should support the established growth strategy of the company (or other). These decisions and the definition of corporate strategies are the responsibility of strategic management, which considers these issues in the strategic management of the company:
As strategic management has developed as a separate sub-discipline, various methodologies, tools and concepts for growth strategies have emerged from academia and successful companies. These help the strategic management of a company to competently answer the questions posed above and provide the processes by which the chosen strategies can be implemented. In the following lines, we will focus on market share measurement methods, in particular the Ansoff matrix and its application in growth strategies. Before that, however, we will briefly mention the absolute and relative market share of the company - this concept plays an important role in the strategies presented.
How to achieve optimal profit generation? By taking a stronger competitive position. This is achieved, among other things, by achieving a higher market share - as the company's market share grows, so does its profit. This in turn, assuming functional economies of scale, is associated with a fall in costs (and thus easier to purchase components or manufacture in-house), easier access to resources and an increased level of efficiency in the handling of the company's assets and liabilities. As market share increases, so does the performance of the company. Market share can be further classified into two main categories:
Experience has shown that companies with a higher market share differentiate their products and are more profitable (compared to companies with a lower market share). Companies with a higher market share thus strengthen their competitive position even more - thus it is not a problem for them to sell at higher prices than their competitors. In order to maintain a stable market share, a company needs to provide quality products that customers appreciate and not rely solely on a good level of marketing.
→ Tip: Read more about how to outperform the competition with a blue ocean strategy.
Closely related to the above market share issue are the strategic management tools mentioned above. The most well-known are the Boston matrix (BCG matrix), the McKinsey matrix (GE matrix) and the Ansoff matrix. We will mainly focus on the third of the listed ones, yet some brief information about the first two:
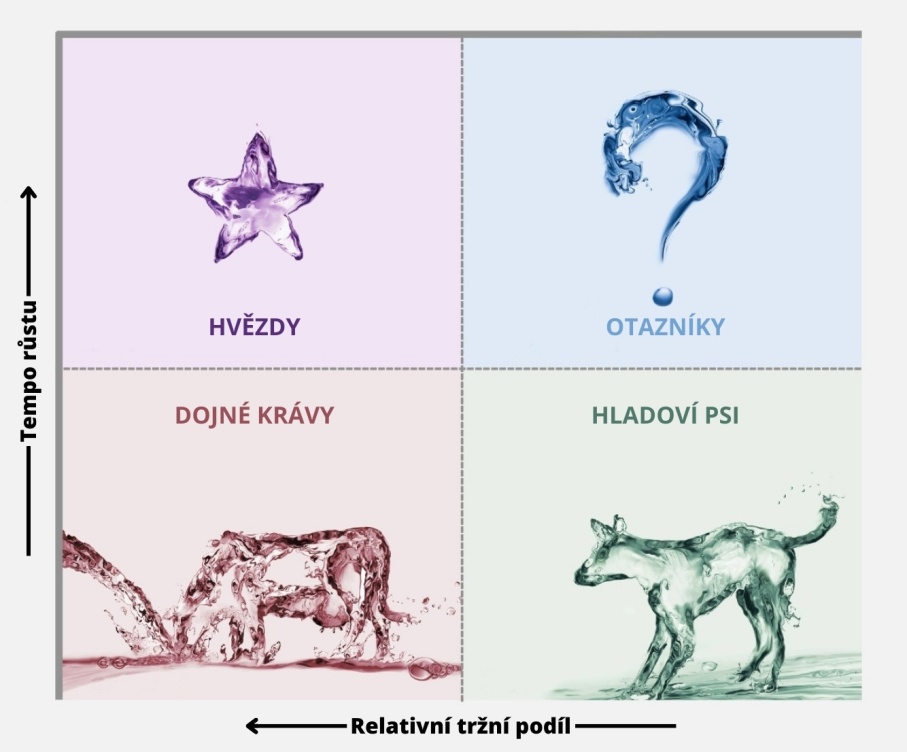
This is a portfolio model developed by the Boston Consulting Group (which is why this matrix is sometimes referred to as the "Boston Matrix"). It helps to visualize the connections between the growth rate of completed deals and a company's competitive position. The strategic management of the company can use this matrix to make decisions about resources and investments in further development. In fact, the company's products are classified into 4 quadrants according to the market share and growth rate of a given segment. It is recommended to invest in products marked as "stars", while it is more profitable to withdraw "hungry dogs" from sale.
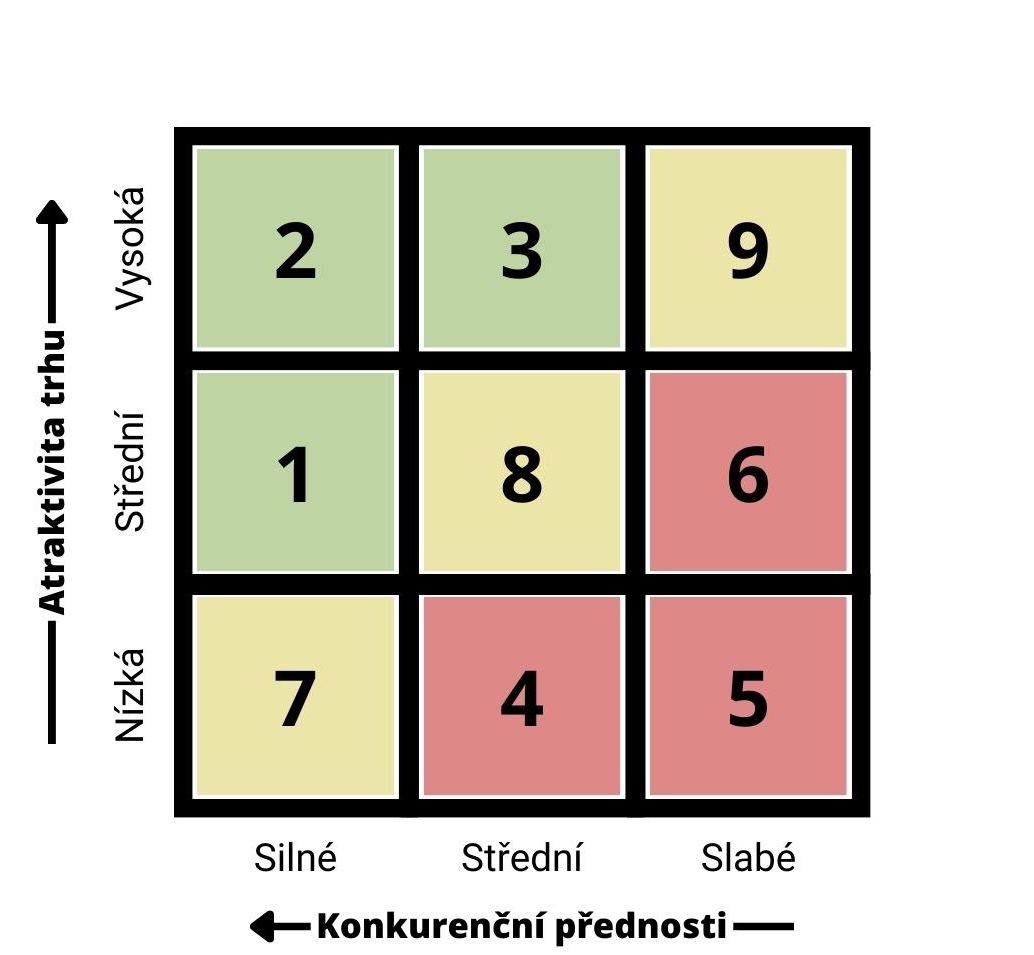
A multi-factor analytical portfolio methodology developed by McKinsey for General Motors (hence the alternative name "McKinsey matrix"). Its creation was initiated, among other things, by a certain inadequacy of the above-mentioned BCG matrix. The GE matrix has a similar purpose to the BCG matrix, but in contrast it contains 3 × 3 fields, thus providing the possibility of a broader concept and a more comprehensive assessment of the company's situation in terms of strategic management. The individual segments then define recommendations for growth or decline in investment in the products in question; each of the 3 segments then form zones (the "green" fields are advisable to invest in, the opposite is true for the "red" fields).
→ Tip: Take a look at the 4P and 7P marketing mix and its importance for the success of a business.
Another tool for strategic business management is a product matrix that takes into account expansion into new markets - the so-called Ansoff matrix (sometimes also called product-market matrix). It helps to identify opportunities for market share growth. It is also used in cases where a product is at the end of its life cycle (in the Boston matrix these are products in the "hungry dogs" quadrant) to assess the profitability of reselling that product.
The Ansoff matrix provides information for selecting an appropriate market-product growth strategy for a company, including consideration of any associated risks. It is a two-dimensional matrix: the vertical 'y' axis represents existing and new markets, while the horizontal 'x' axis is reserved for the company's existing and new products.
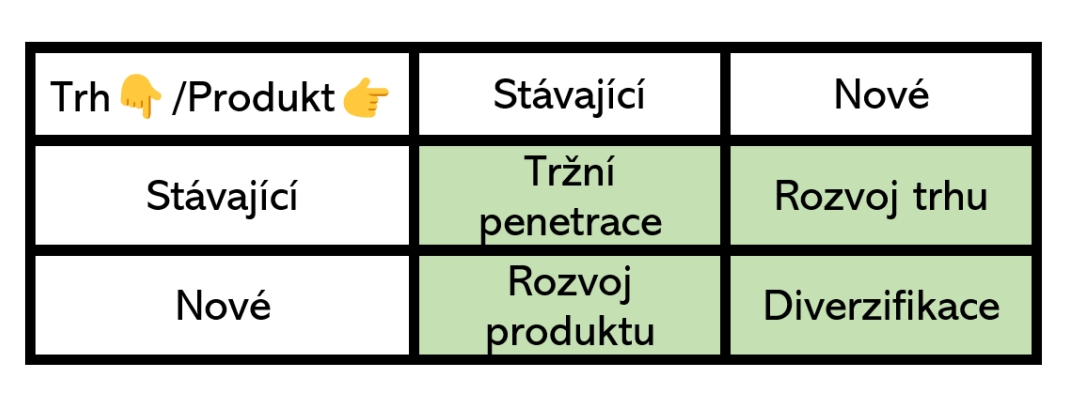
Combining the variables considered, we obtain four possible strategies: market penetration, product development, market development and diversification. Let's take a closer look at them.
It is sometimes referred to as the market leader strategy. The literature on this strategy states that the firm tries to penetrate deeper into the existing market with the product it produces. It is chosen especially when the product is in the early stages of its current cycle - the firm intends to expand production and increase sales (using existing resources, capacities and processes). The market penetration strategy intensifies marketing activities (sales promotion, advertising, etc.) on which all other strategic actions are based. The following aspects are combined:
This is the least risky strategy, but if the company implements it incorrectly or with the wrong resources, it is necessary to do otherwise. This strategy is favoured by companies with a high market share (about 40 % of the market).
Sometimes referred to as a market challenger strategy. With a market development strategy, the company seeks to find a new market (or several new markets). This growth strategy can be implemented by two methods:
This growth strategy is chosen when the market is already saturated with products or when competition in a given market is too strong. Another alternative is that the switch to new products is too difficult or a legal restriction arises in the market. Companies try to make their products available to a new segment of customers, by expanding or improving distribution channels or by a new form of promotional campaign.
This is a riskier strategy than market penetration. It accounts for approximately 30 % of the market.
You may also come across the name market follower strategy. This ambitious growth strategy says that the company will offer new products or product innovations in existing markets. It invests in product development and research, at the end of which it introduces an innovative or completely new product. The product development strategy is also used by manufacturers who currently have their own product in the maturity phase of its life cycle (and at the same time the product has regular customers). A typical example is the automotive segment, where car manufacturers churn out one new model after another. If a company is successful and strong in innovation, this strategy can lead to an increase in market share.
This is again a riskier strategy than the previous two. It is chosen by around 20% of the market.
Some sources give the alternative name of the market spender strategy. It is characterised by a focus of corporate activities on new products for new markets. A flawless market analysis and impeccable project preparation are important in this strategy. It is also financially demanding, as the company has to look for new distribution channels and promotion methods and does not yet know its new customers or know how to reach them. This strategy can be implemented in the following forms:
This is by far the riskiest strategy compared to the previous three. It is chosen by only 10% of the market, usually by companies serving small market segments.
Whichever strategy you choose, it is essential to have the most up-to-date data - ideally live data - at hand. And that's exactly what a quality ERP or CRM system will provide. At Algotech, we have been implementing and managing enterprise information systems in the Czech Republic and abroad for more than 25 years, and we provide 24/7 support for them. Get in touch with us, we have an experienced team of over 120 permanent specialists who have always completed every project, even the most challenging ones.

Copyright © 2026 - Algotech a.s., all rights reserved
| Personal data processing |
Terms and conditions